Performance Optimization Walkthrough: Shaving 4 Seconds Off a Load Time, Line by Line
A line-by-line walkthrough of cutting four seconds from a slow product page: images, fonts, JavaScript, third-party scripts and caching.

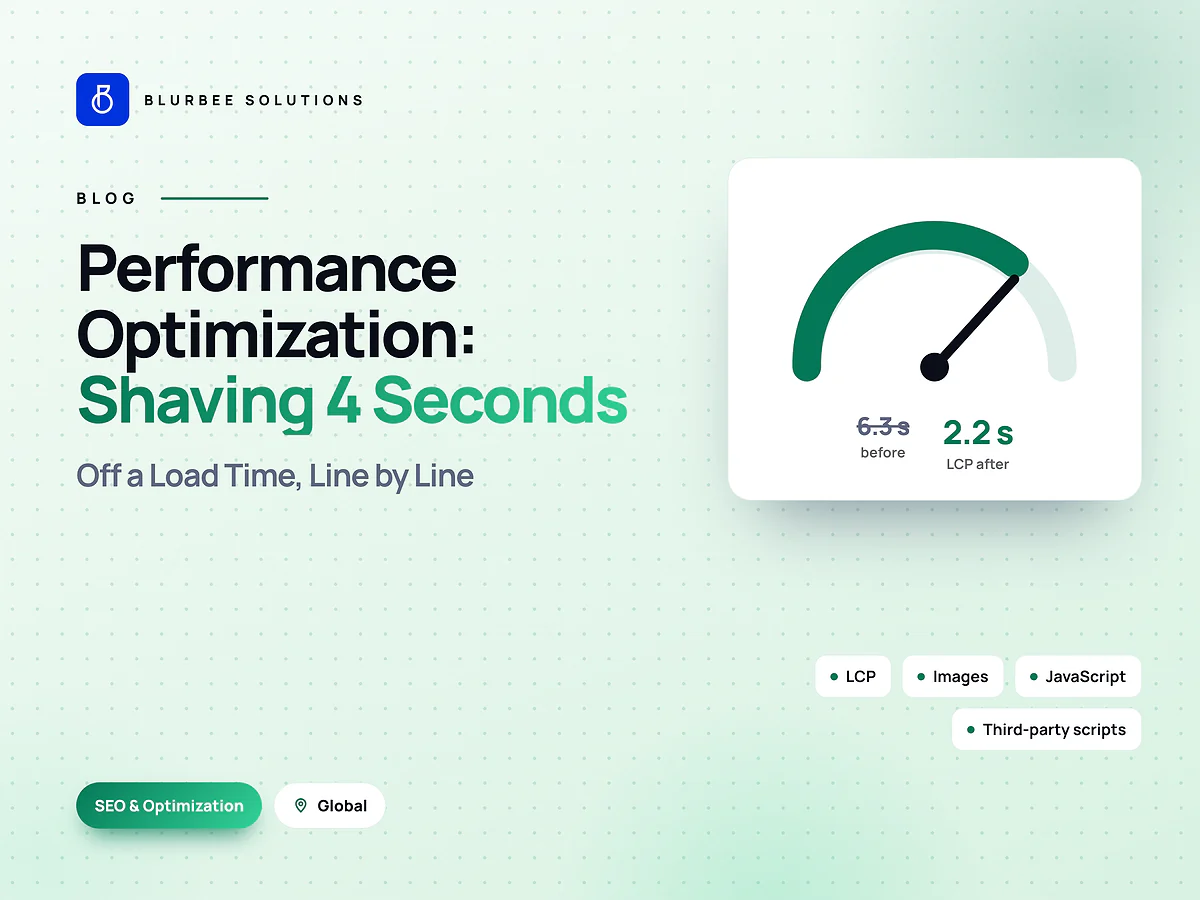
Slow pages are rarely slow for one reason. They are slow because of a dozen small decisions, each reasonable on its own, that add up. This walkthrough shows how we take a typical slow product page from a Largest Contentful Paint of about 6.3 seconds to about 2.2 seconds on a throttled mobile profile, one fix at a time.
A note on honesty: this is a composite example. It combines the most common problems and fixes from product pages we have worked on, so no client's data is disclosed. The numbers are illustrative; the method is exactly what we do. For how performance fits into a wider technical SEO audit, see our technical audit checklist.
The starting point
A product page on an e-commerce site, tested on a mid-range phone profile with a throttled mobile connection:
- LCP: about 6.3 seconds. The largest element is the main product image.
- INP: poor, with long tasks when tapping the size selector.
- CLS: poor, because a promotional banner loads late and pushes content down.
- Page weight: several megabytes, most of it images and JavaScript.
- Third-party requests: more than the site's own.
Google treats an LCP of 2.5 seconds or less, INP of 200 milliseconds or less and CLS below 0.1 as good, measured at the 75th percentile. We are a long way off.
Fix 1: the hero image (about 1.6 seconds)
The main product image was a large JPEG served at desktop resolution to every device, lazy-loaded by a plugin, and discovered late because it was set by JavaScript.
Changes:
- Right size for each screen, using
srcsetandsizes. - Modern format, WebP with a fallback.
- Explicit width and height, so the browser reserves space.
- Never lazy-load the LCP image, and give it
fetchpriority="high". - Put it in the HTML rather than injecting it with JavaScript, so the browser finds it immediately.
This is the single largest win on most pages we see.
Fix 2: third-party scripts (about 0.9 seconds)
A tag manager loaded analytics, two advertising pixels, a heatmap tool, an A/B testing script, a reviews widget and a chat widget, all in the head, all competing with the page's own resources.
Changes:
- Removed tools nobody was using.
- Deferred analytics and pixels until after the page was usable.
- Loaded the chat widget on interaction, showing a lightweight button until then.
- Moved the A/B test server-side for the tested element instead of hiding the page until the script ran.
Third-party scripts are often the biggest performance cost that nobody owns.
Fix 3: JavaScript (about 0.7 seconds, plus INP)
The page shipped one large JavaScript bundle containing code for every page on the site, including an unused carousel library and a date library loaded for a single label.
Changes:
- Code-splitting so the product page loads only what it needs.
- Removed or replaced heavy libraries with smaller alternatives or native browser features.
- Deferred non-critical components such as reviews and recommendations below the fold.
- Broke up long tasks in the size selector handler, which fixed most of the INP problem.
Fix 4: fonts (about 0.4 seconds)
Two web font families in four weights, loaded from a third-party server and discovered late through a CSS import.
Changes:
- Self-hosted the fonts.
- Subset them to the characters actually used.
- Reduced weights from four to two.
- Preloaded the main font and used
font-display: swapso text shows immediately.
Fix 5: server and caching (about 0.5 seconds)
Every product page was rendered on each request, with no CDN caching of HTML and short cache lifetimes on static files.
Changes:
- CDN caching of HTML for anonymous visitors, with short lifetimes and background revalidation.
- Long cache lifetimes for fingerprinted static assets.
- Compression for text responses.
Fix 6: layout shift
Not an LCP gain, but it fixed CLS: the late promotional banner now has reserved space, images have dimensions, and the reviews widget has a placeholder of the right height.
The result
In this composite, LCP moves from about 6.3 seconds to about 2.2 seconds on the throttled mobile profile, INP drops into the good range, and CLS falls below 0.1. Real-user field data takes a few weeks to reflect the change, because it is measured over rolling periods.
Keeping it fast
Performance erodes. Every new feature, image and marketing tag adds cost. The fix is performance budgets in CI: automated checks on every pull request for page weight, JavaScript size and lab timings, which fail the build when limits are exceeded. Pair that with a rule that every new third-party script needs an owner and a reason. For ongoing care, see what a maintenance retainer should include.
The order matters
We fix in order of impact per hour of effort. On most pages that means:
- The LCP element, usually one image or headline, which is often an afternoon's work for a large gain.
- Third-party scripts, which need decisions from marketing more than engineering time.
- Fonts and caching, quick and reliable wins.
- JavaScript restructuring, the most effort, done once the easy gains are banked.
- Layout shift fixes, often small and worth doing alongside the rest.
Starting with a framework migration or a redesign because "the site is slow" usually spends months to get gains that the first three steps would have delivered in days.
Measure before and after
We record lab measurements on a fixed throttled mobile profile before and after each fix, so each change's effect is known. We also track field data from real users, which is what Google uses for Core Web Vitals and what your customers actually experience.
Start with a measured audit
Our first fixed-scope project is two to four weeks: we measure your key templates on real mobile conditions, ship the quick wins, set budgets in CI, and give you a prioritised list for the rest. We do this for teams across India, the United States, the United Kingdom, the UAE and Canada; see SEO and optimization services.
Page speed, in numbers
Blurbee composite example based on common fixes across product pages we have optimised, measured on a throttled mobile profile. Illustrative, not a named client; real gains vary.
Why teams make their sites fast with Blurbee
We measure on real mobile conditions, fix at the code level, and put performance budgets in CI so the gains do not disappear with the next release. Engineers implement the fixes, not just a report.
- Fixed-scope first projectTwo to four weeks, priced as a number rather than an estimate, so you have evidence before a longer commitment.
- One delivery lead, namedYou always know who to ask. No account manager relaying questions to a team you never meet.
- Code and IP are yoursAssigned in writing, handed over with repositories, infrastructure definitions and documentation whether or not you continue with us.
- Performance budgets in CICore Web Vitals and bundle size gate the build. Slow does not ship.
- Accessibility to WCAG 2.2 AAReviewed with automated and manual passes, not claimed on a slide.
- Written overlap disciplineStanding calls inside your working window, everything else asynchronous with a decision log.